Maps
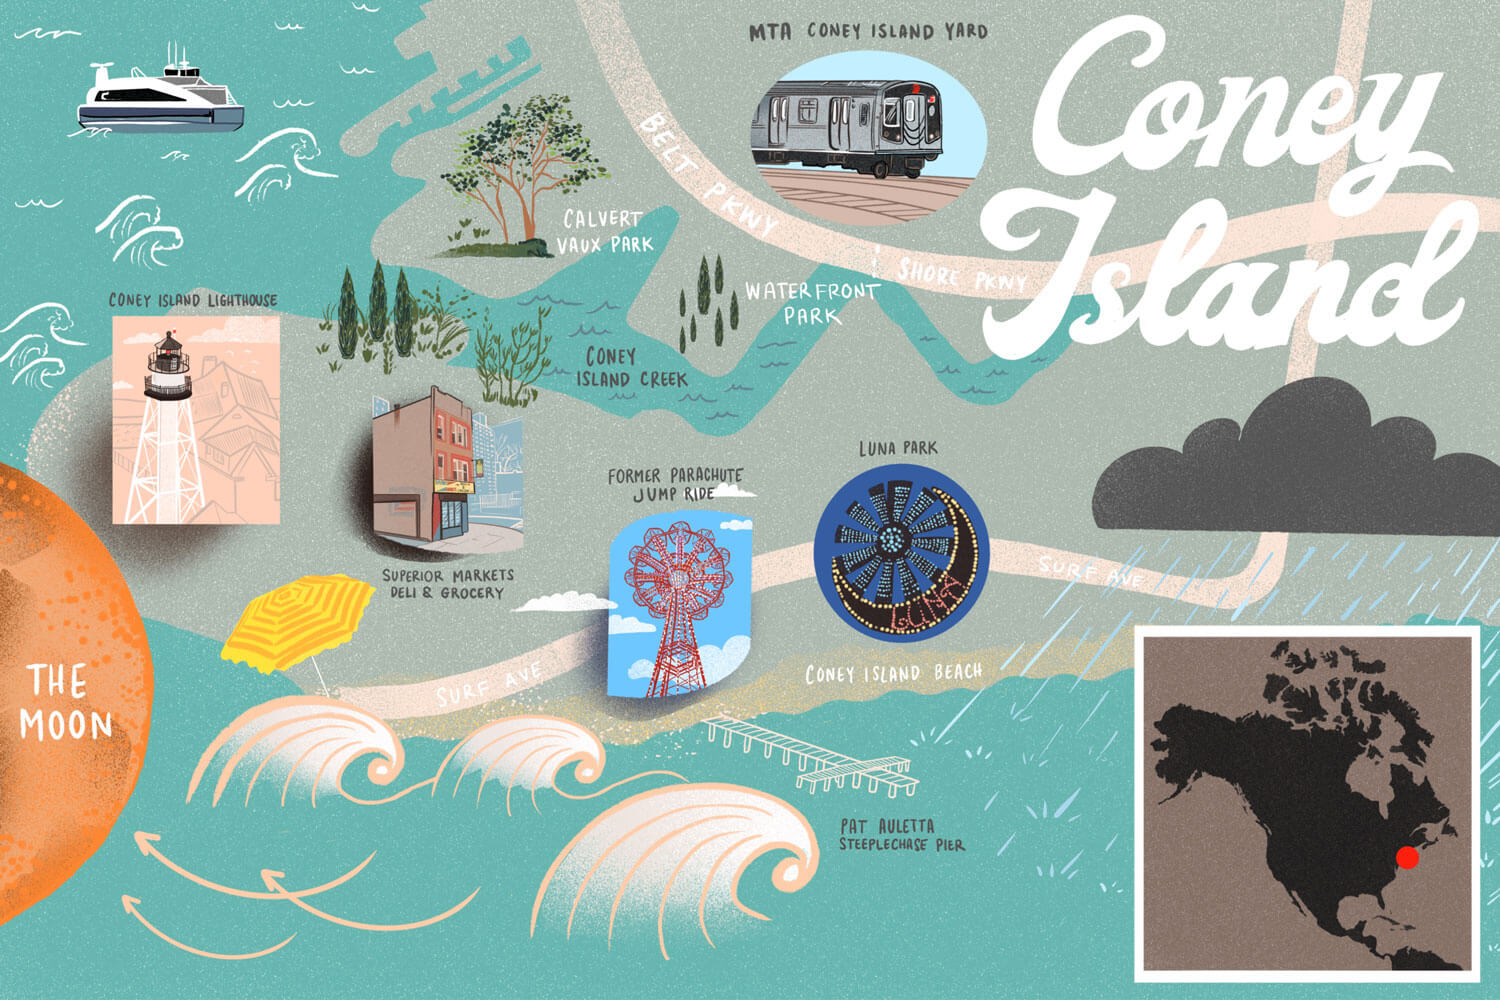
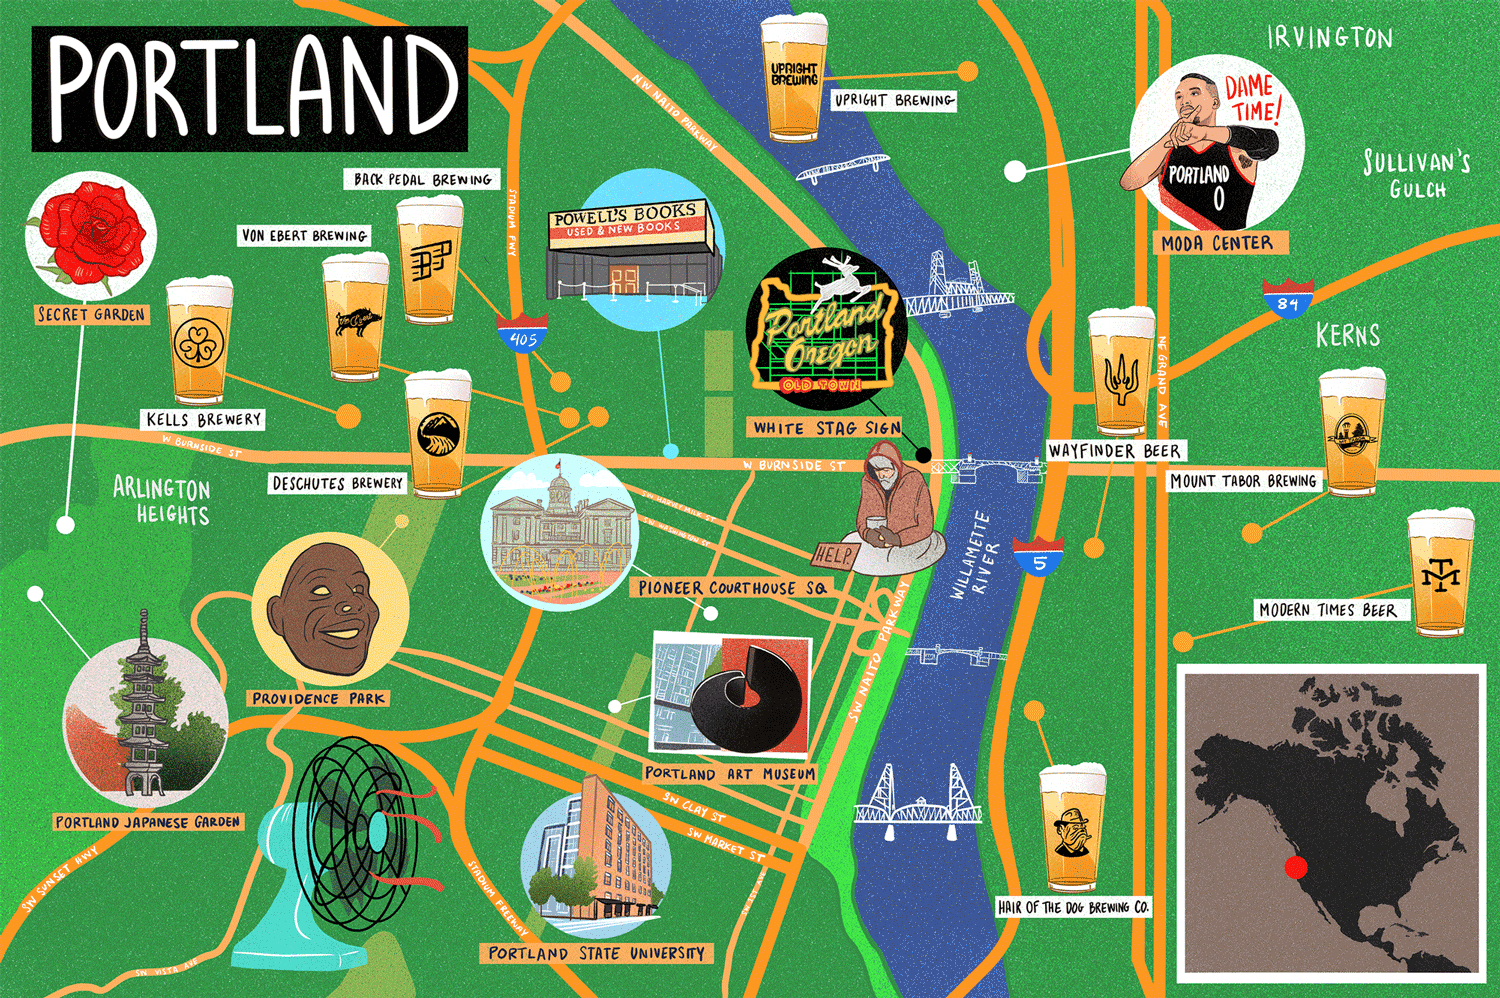
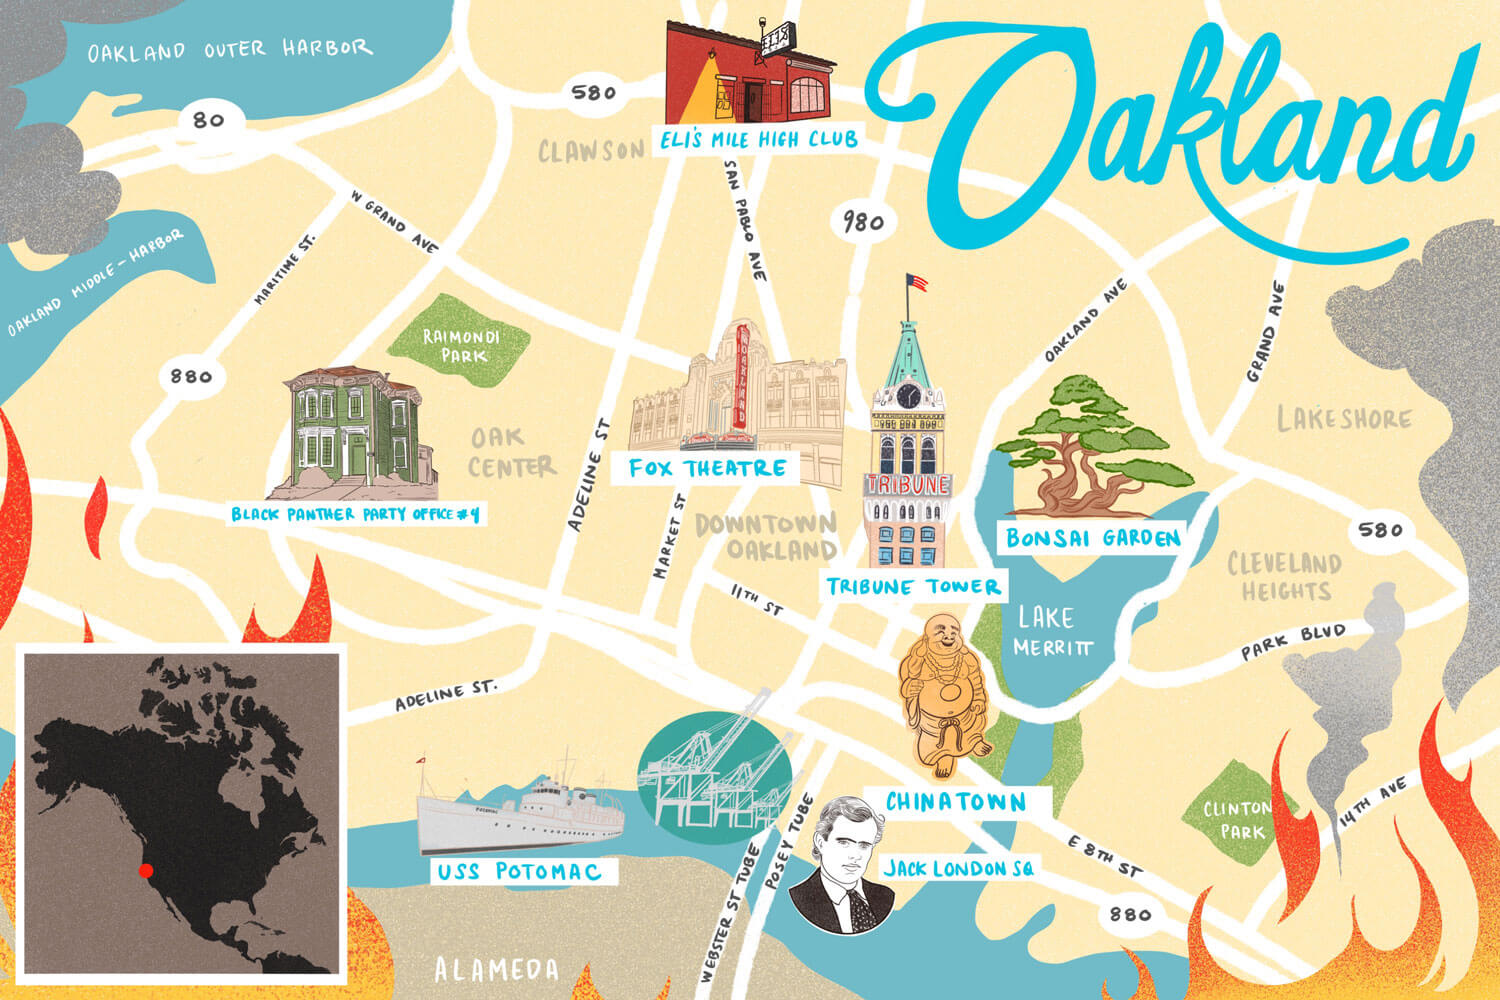
Climate Change Is Real
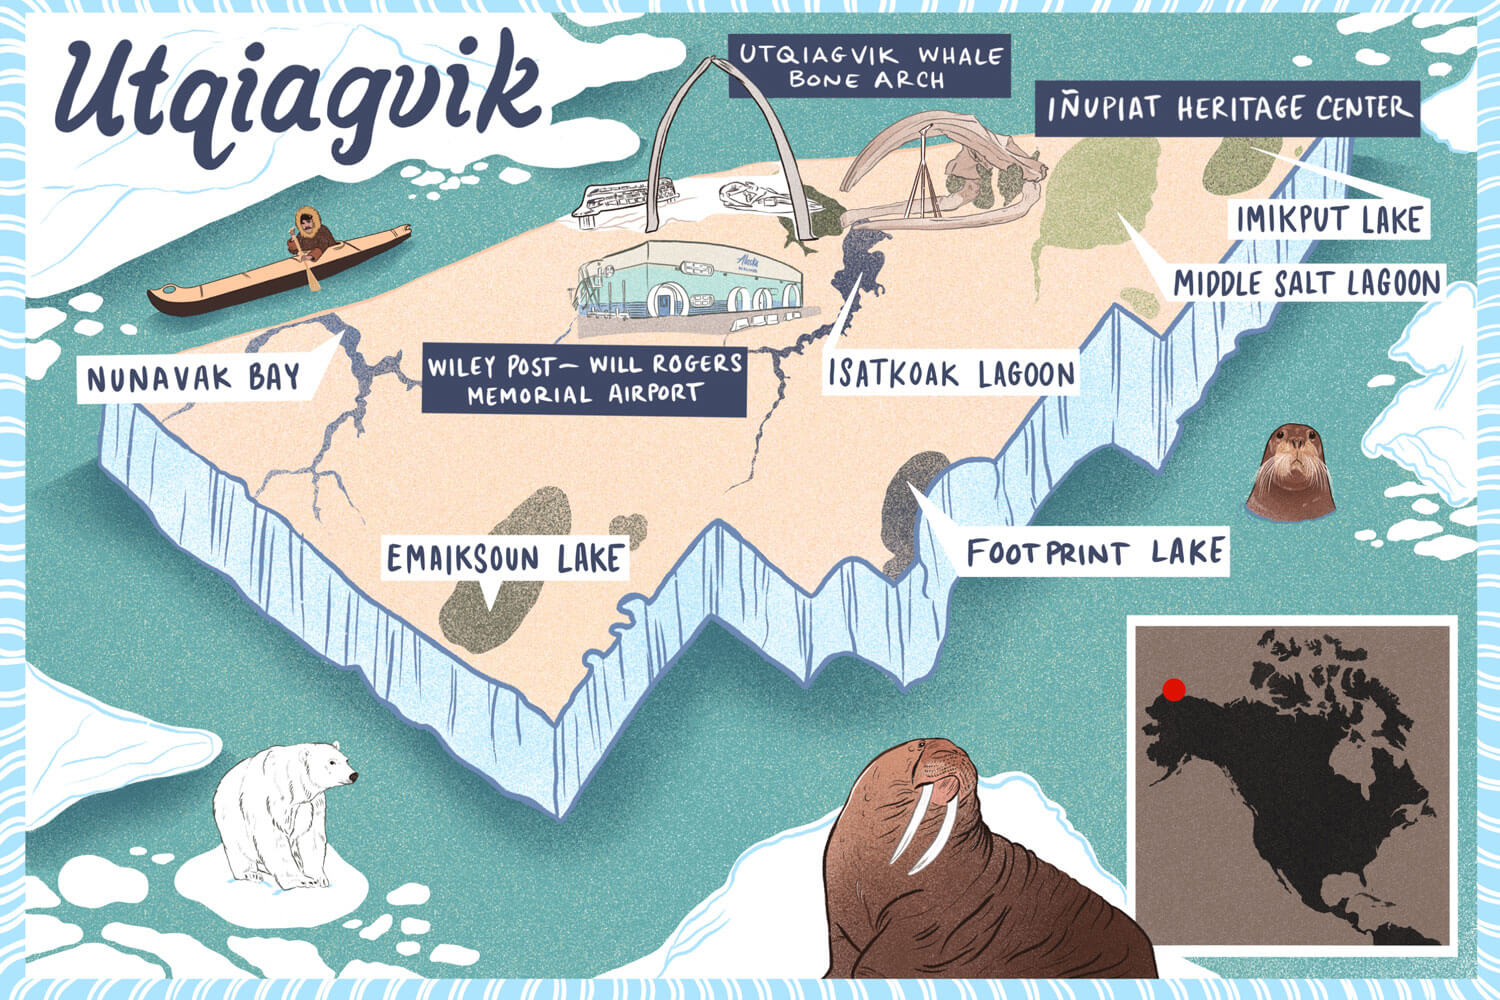
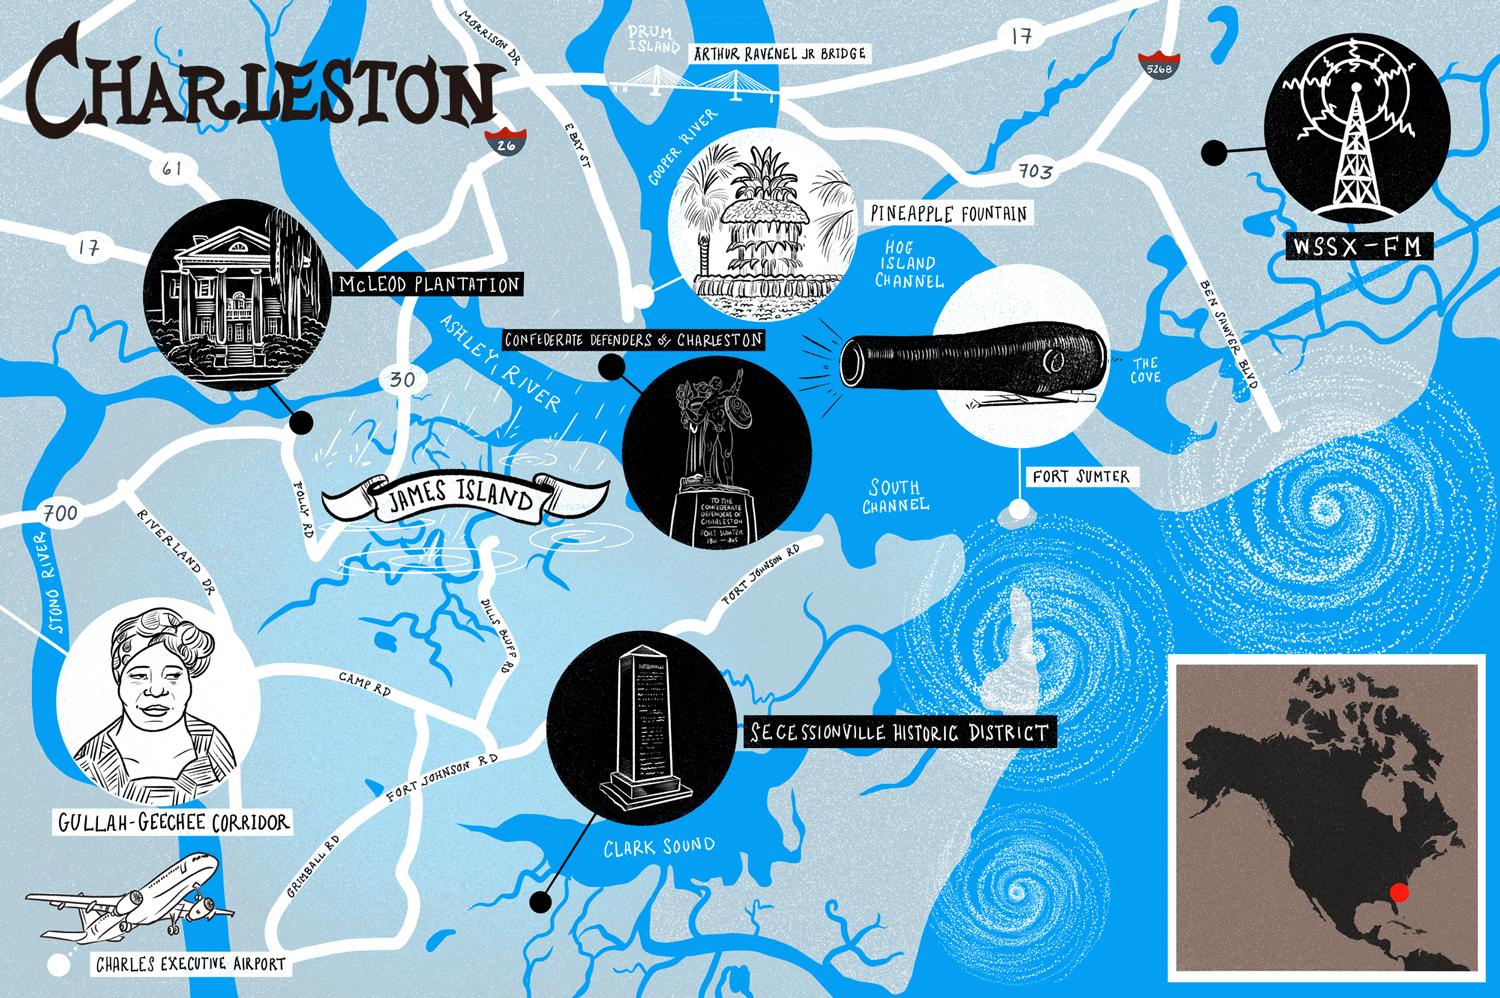
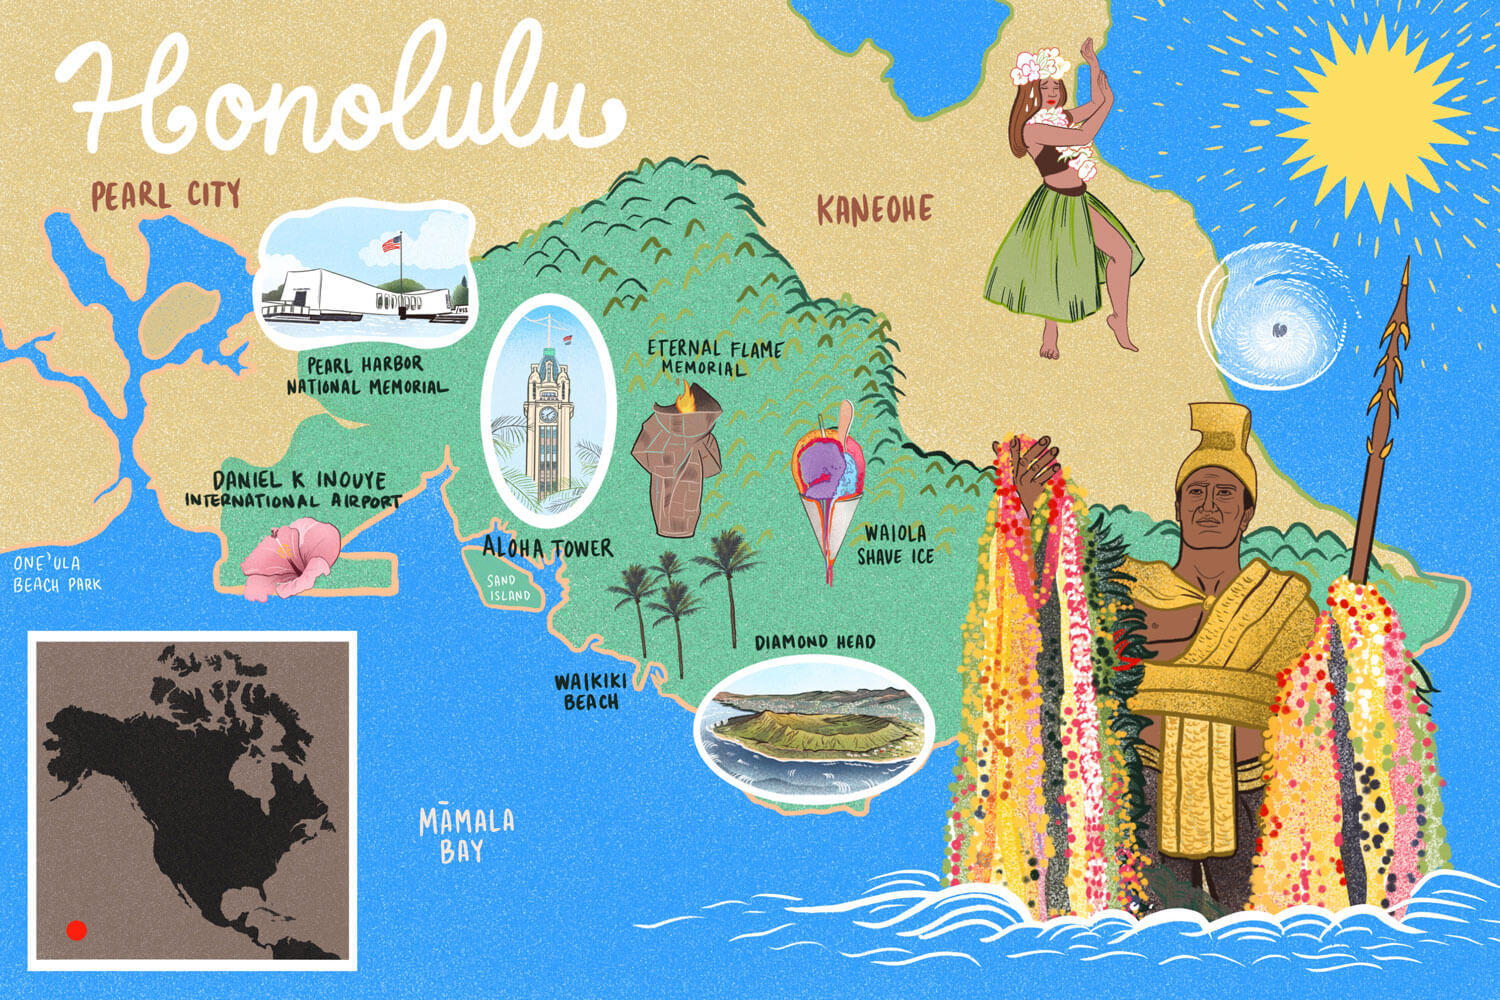
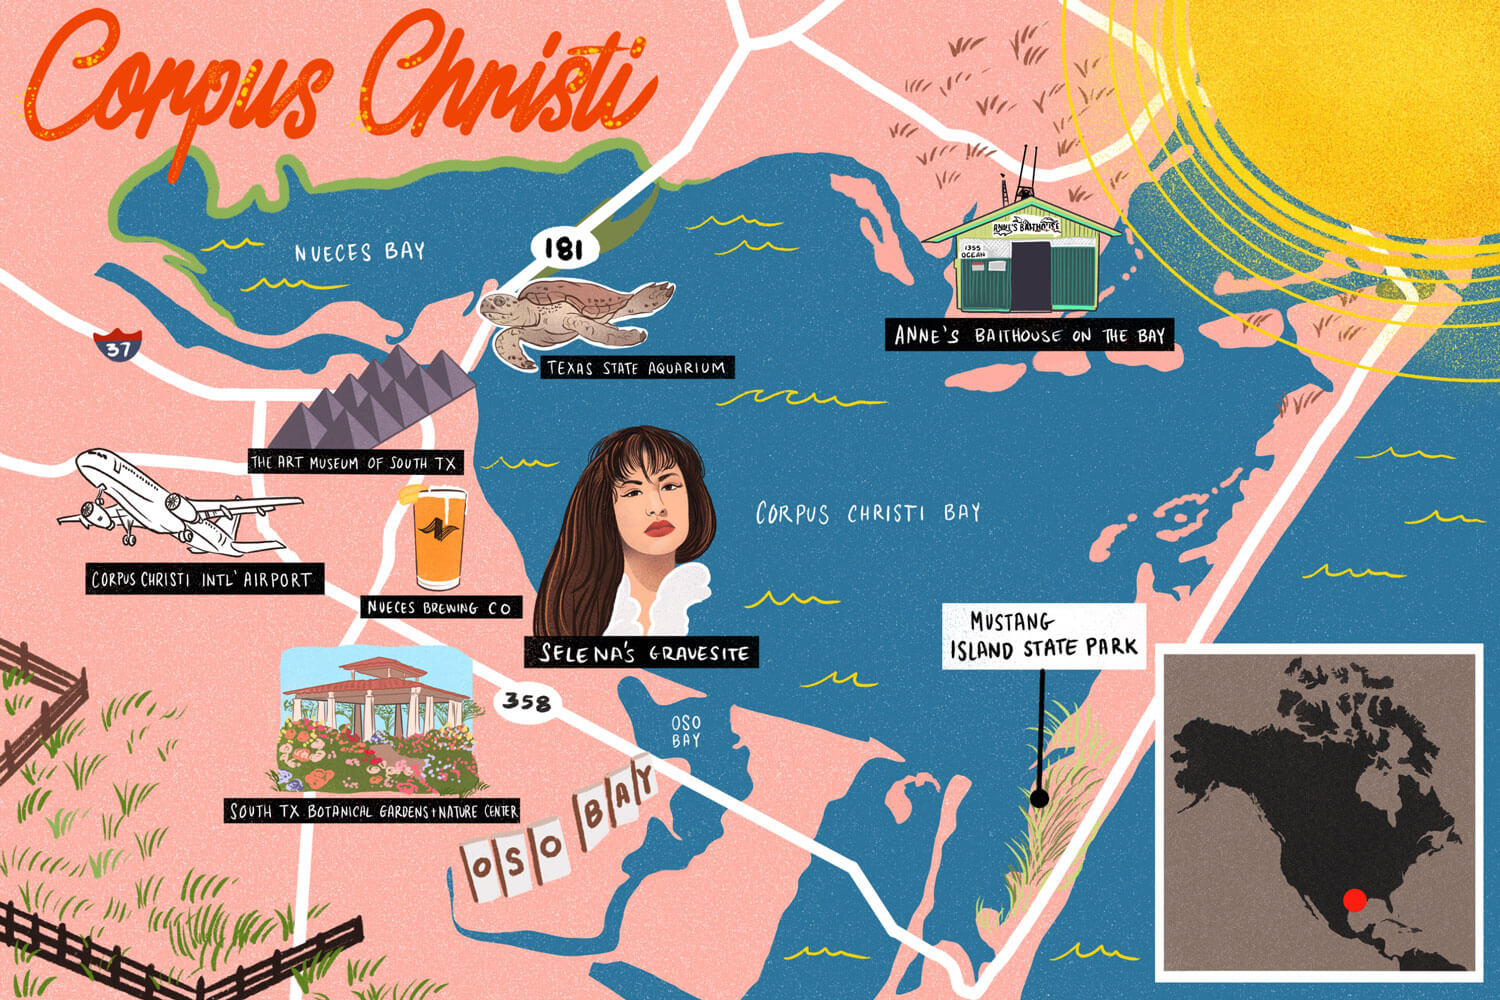
With bright colors, famous and not so famous local landmarks, as well as informal typography—these maps are to help readers visualize the alarming impact of climate change in their communities. I worked closely with the Data Visualization, Creative and Editorial teams at WhoWhatWhy.org on this seven-part series.
You can read more here.
.